
Why relative risk numbers can be misleading is a question worth ten seconds of your attention every time a headline tells you a treatment, a test or an exposure carries “twice the risk.” A relative risk tells you how much bigger one risk is than another. It does not tell you how big either of them is, and that missing half is where most of the drama lives.
The pairing that experienced clinicians and data-literate readers keep coming back to is simple: a relative risk cannot be read without the absolute risk it sits on top of. One number describes the size of a difference between two rates. The other describes the size of the thing itself. When a story gives you only the first, you are being asked to guess the second.
Below is a plain-language way to do that arithmetic yourself, plus a checklist for the risk numbers you meet in the news, on a drug label or in a clinic conversation. Nothing here is medical advice, and none of the examples describe any real person’s risk.
Table of Contents
- What does relative risk mean?
- Why can relative risk numbers be misleading?
- Why relative risk numbers can be misleading when the baseline is hidden
- How do you turn relative risk into absolute risk?
- How relative risk, absolute risk, odds ratio and NNT differ
- Why are percent increase and percent reduction different?
- How does headline framing change the impression?
- What should you check before trusting a risk statistic?
- Frequently Asked Questions
- Is a high relative risk always dangerous?
- Why does a 100% increase in risk not always mean the outcome doubled?
- Is a relative risk of 1 harmful or beneficial?
- What is the difference between relative risk and absolute risk?
- Can relative risk statistics be manipulated through headline wording?
- Conclusion
What does relative risk mean?
Relative risk is the risk of an outcome in the exposed group divided by the risk of the same outcome in the unexposed group. A relative risk of 2 means the exposed group had twice the rate. A relative risk of 1 means the two groups had the same rate. A relative risk below 1 means the exposed group had a lower rate.
That definition is easy. The trap is that the number is a ratio, and a ratio has no scale of its own. Ten percent of a million and ten percent of ten people are the same percentage, and the same relative change applied to each produces wildly different numbers of people.
So what does a relative risk of 0.5 mean? It means the exposed group had half the rate of the comparison group. What does a relative risk of 0.75 mean? It means a quarter lower. What does a relative risk of 1.2 mean? It means one in five higher, which is the one most often dressed up in a headline as a dramatic jump.
And yes, a relative risk can be greater than 1. It can be less than 1, and it can be very large when a rare outcome is being compared against a near-zero baseline. The size of the number tells you about the strength of the comparison, never about the seriousness of the outcome.
Why can relative risk numbers be misleading?
Because the number only describes the gap between two rates, and the size of that gap depends entirely on where you started. The same 1.2 can mean a difference of one person in a thousand or a difference of one in five, depending on the baseline. Readers usually meet the ratio with no sense of which world they are standing in.
That is the whole mechanism. Not a conspiracy, not usually a lie — just a ratio printed without the denominator, sitting in a headline that was written to be read rather than to be understood.
Why relative risk numbers can be misleading when the baseline is hidden
Take a hypothetical screening result. A condition runs at 1 in 200 in the group being screened. A test flags some of those cases, and the flagged group turns out to have a rate of 2 in 200. That is a 100% increase — a doubling. In absolute terms it is one extra case per 200 people screened.
Now take a much rarer outcome, 1 in 10,000. An exposure lifts it to 2 in 10,000. Same 100% increase, same doubling, and the absolute change is one extra case per 10,000.
Pull the other lever and the message flips. Halving a baseline of 40% down to 20% is a 50% reduction, which sounds modest next to a headline about doubling. In absolute terms it is 20 percentage points — two in ten people spared instead of one in a thousand.
So a large relative increase can be trivial, and a modest relative change can matter enormously. Neither is wrong. Only one of them can be read without the baseline.
How do you turn relative risk into absolute risk?
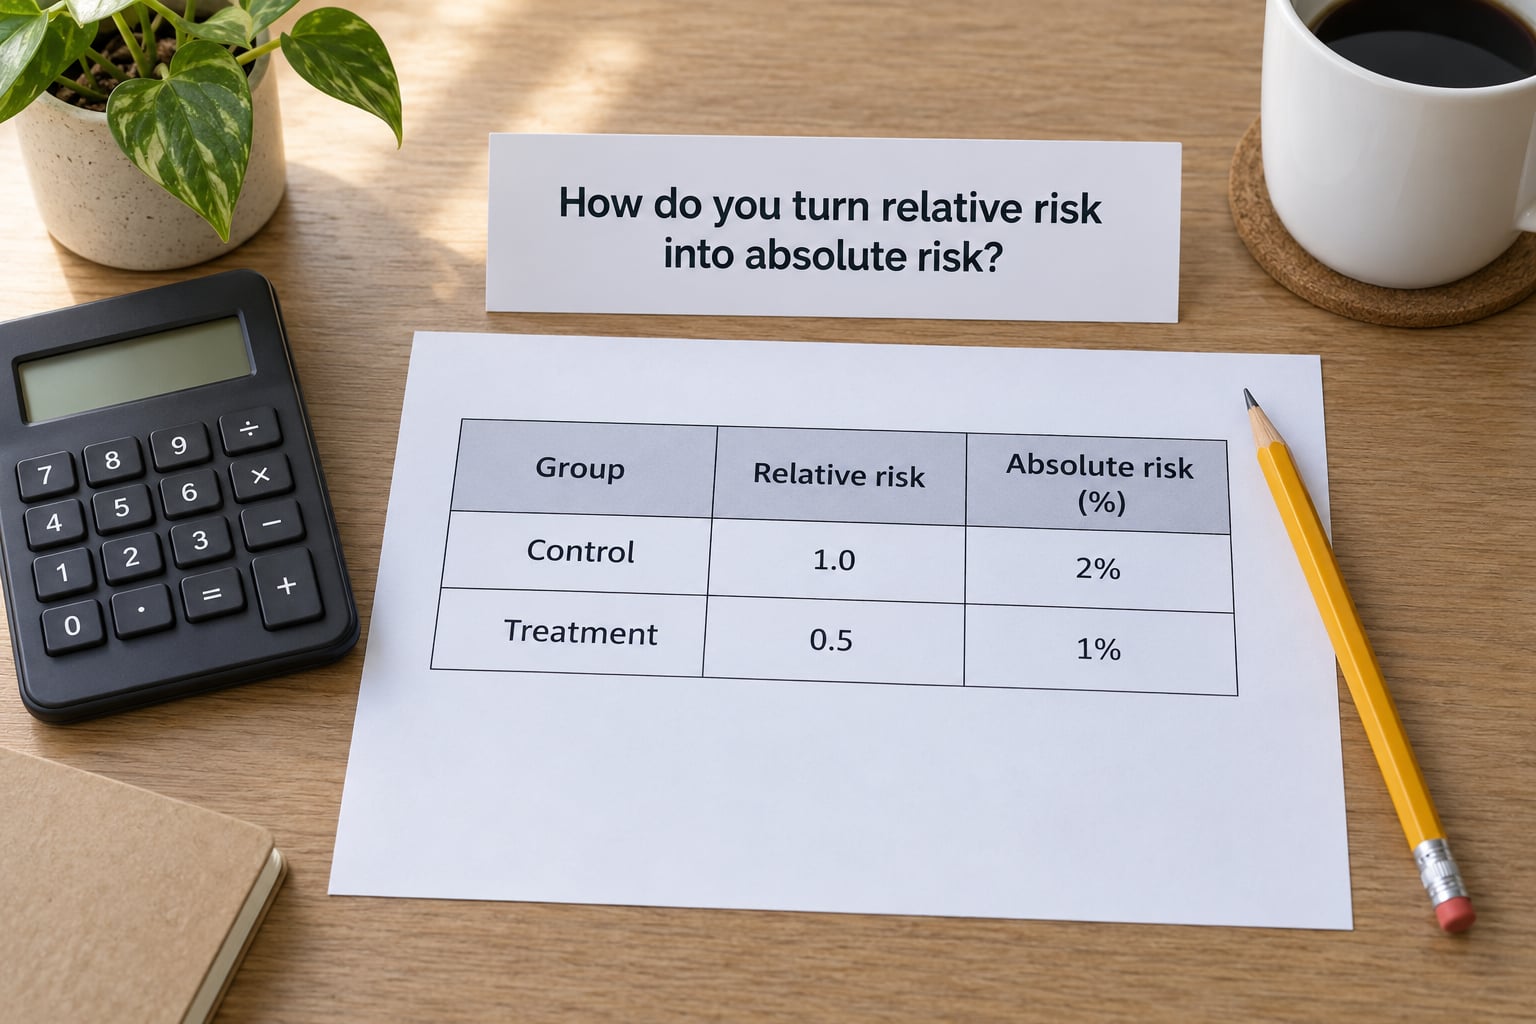
Three steps, no training required. First, find the baseline rate in the comparison group — the number the article or label leaves out. Second, multiply that baseline by the relative risk to get the exposed group’s rate. Third, subtract one rate from the other to get the absolute risk difference, then express it in people rather than percentages.
Applied to a relative risk of 1.2, here is what the same ratio looks like at four different baselines. The relative number never changes. Everything an ordinary reader actually needs to weigh does.
| Baseline risk (unexposed) | Relative risk | Risk in exposed group | Absolute difference | In people per 10,000 |
|---|---|---|---|---|
| 0.5% (5 in 1,000) | 1.2 | 0.6% | +0.1 percentage points | 10 more |
| 2% (20 in 1,000) | 1.2 | 2.4% | +0.4 percentage points | 40 more |
| 10% (1 in 10) | 1.2 | 12% | +2 percentage points | 200 more |
| 40% (2 in 5) | 0.5 | 20% | 20 percentage points lower | 2,000 fewer |
You can sanity-check yourself in a few seconds. If a study reports a “huge” relative change and the baseline is a fraction of a percent, the absolute story is usually a handful of people. If the baseline is one in five, even a small ratio is moving a lot of people.
How relative risk, absolute risk, odds ratio and NNT differ
Odds ratios get mixed in because trial reports often publish them, and they behave differently at low event rates. When an outcome is uncommon, an odds ratio overstates the relative risk. Read a study reporting an odds ratio of 2.0 for an event affecting a fraction of a percent of participants, and the true relative risk is closer to 1.9; push the rarity further and the gap widens. The same study’s relative and absolute numbers only agree when the event is common, which is rare in research.
The number needed to treat is the bridge back to something concrete. Divide 1 by the absolute risk reduction and you get how many people need the treatment for one to benefit. A 2% absolute risk reduction gives an NNT of 50. A 0.1% absolute increase in harm gives a number needed to harm of 1,000.
| Measure | What it tells you | What it needs to make sense | Best used for |
|---|---|---|---|
| Relative risk | How many times bigger or smaller the risk is | The baseline rate | Comparing like-for-like groups, setting priorities at population level |
| Absolute risk | How common the outcome actually is in people | Nothing beyond the population you are describing | Personal decisions, consent, weighing benefit against burden |
| Absolute risk difference | The size of the gap in percentage points | Both rates | Judging whether an effect matters to real people |
| Odds ratio | Relative change in odds, not in risk | The baseline, plus how rare the event is | Case-control studies where rates cannot be measured directly |
| Number needed to treat or harm | How many people to reach one benefit or one harm | The absolute risk difference | Conveying effort and exposure involved in a benefit |
One honest caveat: relative risk is not a broken measure. Statisticians on data-science forums point out there is no single universally correct choice, and the context decides. More on that below.
Why are percent increase and percent reduction different?
Because percentage change describes a ratio, while percentage points describe the gap between two rates. Run from 1% to 2% and you have a 100% relative increase — and a one-percentage-point absolute increase. Those are the same fact told two ways, and only one of them can be read without the starting point.
Cut from 40% to 20% and you have a 50% relative reduction, which is the same halving. In absolute terms it is 20 percentage points. Read the two side by side and you can see why “risk cut in half” and “twenty fewer people out of a hundred” get treated as very different news, even when they describe one study.
The three traps worth separating in your head:
| Phrase you see | What it actually reports | Why it misleads |
|---|---|---|
| 20% increase in risk | Relative change in a rate | Reads like 20 extra percentage points, which it is not |
| 20% increase in cases | Relative change in a count | Says nothing about how many cases that is |
| 1% of people affected | Absolute risk in the exposed group | Says nothing about what the same people faced without the exposure |
Percentages are also loose about what they are a percentage of. A “20% higher” figure from a study of 200 people and a “20% higher” figure from a study of 2 million people are the same sentence and not the same claim. Sample size lives further down the paper, and it belongs in your reading.
How does headline framing change the impression?

Same study, same numbers, different impression. Wording is the last place distortion creeps in, and it is the easiest to ignore because nothing about it is false.
| How a finding can be framed | What that framing puts in front of you | What it puts out of view |
|---|---|---|
| “Twice as likely to die” | The multiplier, which reads as enormous | The starting death rate and the survivorship framing |
| “0.16% better survival” | The absolute improvement, which reads as tiny | Nothing important, which is why researchers prefer it |
| “A 20% reduction in risk” | Benefit magnitude without a denominator | How many people must be treated to see one benefit |
| “Risk reduced by 1 in 5” | A fraction people can picture | That the fraction may be 1 in 5 of a very small number |
That first pair is the survivorship trick, and it is worth knowing as a category. A study reported as “32% more deaths” can describe the same data as “0.16% better survival,” depending on whether the researchers counted deaths or counted survivors. Both are arithmetically correct. The first one lands harder, which is why it travels further.
There is a mechanism behind most of this. Research papers get rewritten into press releases by people paid to make findings newsworthy, and headlines get written from the release rather than the paper. A long thread on r/ScientificNutrition makes the same point from the reader’s side: relative risk versus absolute risk, and one cannot be interpreted without the other. The fix is boring — read the study, not the headline, and look for the per 100,000 figure.
Good reporting does exist. Health agencies such as the CDC and the UK Health Security Agency routinely report per 100,000 people, and the BBC’s More or Less has spent years decoding exactly these framings. When you see an absolute count in a story, that reporter did the subtraction for you.
What should you check before trusting a risk statistic?
Four questions, in this order, get you most of the way there. Start with the baseline: what was the rate in the comparison group, before anything happened? Without that number, the relative figure cannot be sized. Then ask what the absolute difference is in people — per 1,000 or per 100,000 — rather than as a percentage of nothing.
Third, look at how the groups were built. A large UK study of pre-eclampsia risk examined women with several risk factors together against women without any, which is why its findings did not transfer neatly to a single factor when researchers later tested them in US data. Selection bias, self-reported exposure, and studies that only look at people who made it into a database all produce numbers that are technically real and practically shaky.
Fourth, check the uncertainty and the time frame. A confidence interval that spans a benefit and a harm means the study cannot tell the direction apart. A finding measured over five years may say nothing about a pregnancy measured over forty weeks. And a statistically significant result can still be too small to matter to a real person’s life, which is a separate question from whether it was reliably measured.
So why relative risk numbers can be misleading is not really a claim that the ratio is a lie. It is a reminder that the ratio is a comparison, and a comparison without its denominator is half a sentence. Reports that leave the baseline out tend to be the ones doing the most persuading per word.
What to ask in a clinic or a midwife appointment is simpler than most people expect: “What is my risk with and without this?” and “How many people would this help out of a hundred?” Threads on r/FamilyMedicine where clinicians answer patient questions about absolute risk and the number needed to treat make the same point — the absolute number is the one that supports a decision. For anything about your own pregnancy, birth or family health, take those questions to your doctor, midwife or pharmacist rather than to a headline, and treat this guide as background reading only.
Frequently Asked Questions
Is a high relative risk always dangerous?
No. A relative risk of 5 sounds alarming, but if the baseline rate is 1 in 1,000, the exposed rate is 5 in 1,000 and the absolute difference is 4 in every 1,000 people. A modest relative risk can be far more serious when the baseline is high. Always ask what the rate was before the exposure, and express the gap in people per 1,000 or per 100,000 before deciding whether it matters for you.
Why does a 100% increase in risk not always mean the outcome doubled?
Because a 100% relative increase is a statement about a ratio, not about the outcome itself. Going from 1 in 1,000 to 2 in 1,000 is a 100% increase and an absolute change of one person per 1,000. Going from 1 in 100 to 2 in 100 is also a 100% increase, and it is a doubling of a far larger number of people. The percentage stays constant while the absolute consequence changes completely.
Is a relative risk of 1 harmful or beneficial?
A relative risk of 1 means the exposed group and the comparison group had the same rate, so on that measure the exposure made no difference. It does not mean the outcome is harmless, only that this exposure did not shift the rate. A relative risk below 1 describes a lower rate in the exposed group. None of these say anything about how common the outcome is in absolute terms, which is the separate number you still need.
What is the difference between relative risk and absolute risk?
Relative risk compares the rate in the exposed group with the rate in the comparison group and answers how many times bigger or smaller it is. Absolute risk is the rate itself, expressed in people, such as 4 in 1,000. Relative risk needs the baseline to be interpretable. Absolute risk can be read on its own, which is why it is the number that supports a personal decision about a test or treatment.
Can relative risk statistics be manipulated through headline wording?
The numbers are rarely invented, but framing changes what a reader remembers. A 32% increase in deaths and a 0.16% improvement in survival can describe the same study, and headlines also drop the baseline or quote only a press release. Comparing versions across outlets, hunting for the per 100,000 figure, and reading the original study are all quick ways to see the shape of the story you were actually given.
Conclusion
Why relative risk numbers can be misleading comes down to one habit: find the baseline, then subtract. Once you have the rate the comparison group started from, the relative number turns into a count of real people, and most of the drama evaporates on contact with arithmetic.
After that, weigh how the study was built, how confident the estimate is, and how long it ran. And for anything touching your own health, your pregnancy or your family, take the absolute numbers to a doctor, midwife or pharmacist, who can put them in the context only your own history can supply.